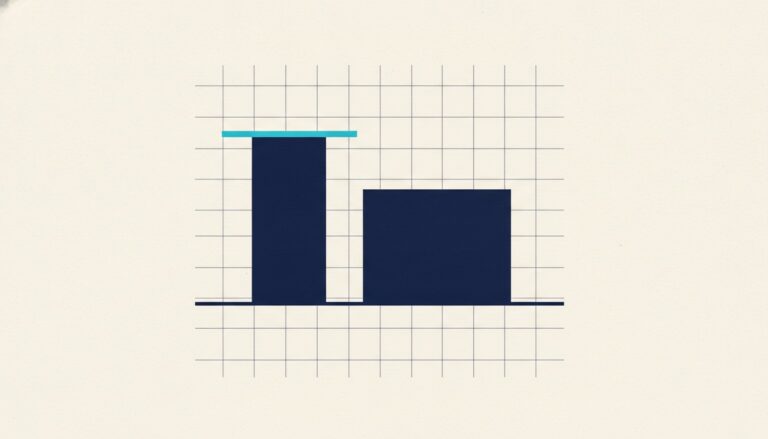
Reading market breadth instead of the headline number
One asset's percentage move is reported as though it described the market. Breadth measures how many assets moved, which is a different question with a different answer.

Almost all market commentary reports one number — usually what the largest asset did — and treats it as a description of the market. It describes one asset. Whether the market moved with it is a separate question, and the two answers frequently disagree.
What breadth measures
Breadth counts participation: of the assets you are looking at, how many rose and how many fell over the period. It is deliberately indifferent to size.
That indifference is the point. A capitalisation-weighted view tells you what happened to the money. Breadth tells you what happened to the assets. On a day when one very large asset rises and most others fall, those two measures point in opposite directions, and only one of them matches the headline.
Computing it
The calculation is deliberately simple, because complexity here buys nothing. Take a defined set — the top fifty by market capitalisation is a common choice — and count how many closed higher over the period.
Report it as a fraction rather than a percentage of a percentage: twenty-six of fifty is clearer than fifty-two per cent, because it exposes the sample size. A breadth figure without its denominator is not checkable, which is why our markets page shows both.
Two decisions shape the result and should be stated: which set of assets, and which period. Breadth across the top fifty and breadth across the top five hundred answer different questions, and neither is more correct.
Magnitude is the second dimension
Breadth counts direction and ignores size. On its own it can mislead in the opposite way: forty-nine assets up a fraction of a per cent and one down thirty per cent produces excellent breadth and a poor day for anyone holding the one.
Pairing breadth with a magnitude measure — the median move rather than the mean, since the mean is dominated by outliers — gives a much more complete picture. The median says what a typical asset did; breadth says how many did it. Together they distinguish a broad small move from a narrow large one, which the headline cannot.
When breadth and the headline disagree
The disagreement is the useful signal, and it comes in two shapes.
A large asset up, weak breadth reading describes concentration: money moving into one or two names while most of the market does not participate. A large asset flat or down, strong breadth reading describes the reverse.
Neither is a prediction, and we do not present them as one. What they are is a correction to a headline that has compressed a market of hundreds of assets into a single number, and the correction is often the difference between two opposite situations that produce identical coverage.
What the figures cannot tell you
Being explicit about the limits, since this is a measurement rather than a forecast:
- Breadth is entirely determined by the set you chose. Changing the sample changes the answer, and there is no neutral sample.
- It says nothing about volume. Assets can rise on almost no trading, particularly the smaller ones.
- It says nothing about tomorrow. A reading describes a period that has ended.
- Reported volume across venues is among the least reliable widely quoted figures in this sector, so any measure weighted by it inherits that unreliability.
Reading it honestly
The discipline that makes this worth doing is stating the method alongside the number: which assets, which period, which provider, and when the data was read. A breadth figure without those is an assertion.
Our approach to this is set out on the methodology page, and the worked version of the calculation is in how to read a crypto market day. The general principle is duller than most commentary and considerably harder to be wrong with: compute several things, say how, and let them disagree in public.
Timeframe agreement is a third check
A single period can mislead in a way that neither breadth nor magnitude catches. A strong day inside a weak month is a different situation from a strong day inside a strong month, and both produce the same daily figures.
Computing breadth over several periods — a day, a week, a month — and noting whether they agree is a cheap addition. Where all three point the same way the reading is consistent. Where the short period diverges from the longer ones, the honest description is that they disagree, which is more informative than picking whichever supports a narrative.
This is deliberately not a signal. It is a way of describing a market without implying that a single timeframe is the true one.
Why the median rather than the mean
Worth being explicit, because the choice does real work. Crypto returns are heavily skewed: a small number of assets post very large moves in either direction.
The mean is dragged around by those outliers, so an average move can be strongly positive on a day when most assets fell. The median is the middle observation and is unaffected by how extreme the extremes are. For describing what a typical asset did, the median is the honest statistic and the mean is the one that produces better headlines.
Where we publish an average we say which one it is, for exactly this reason.
The set determines the answer
One more caveat that deserves its own space, because it is the easiest way to produce a misleading breadth figure without stating anything false.
Breadth across the top fifty by capitalisation is dominated by established assets. Breadth across a wider set includes many small, thinly traded ones whose prices move on very little volume. A publication can produce almost any breadth reading it likes by choosing the sample, and none of the resulting numbers is a lie.
The only defence available to a reader is a stated method. Where a breadth figure appears without the set, the period and the source, it is not checkable, and an uncheckable statistic is an opinion with a number attached.